

Browser DevTools Secrets: Start-up, Network and Performance
During the past decade, browser development tools (browser DevTools) have evolved from basic JavaScript consoles to fully-integrated development and debugging environments. It’s become possible to alter and inspect any aspect of your web application but few of us venture beyond the basics.
In this article, we’ll explore a range of features you may or may not have considered. Chrome’s DevTools are described in most cases but alternative options are shown for Firefox where available.
original article posted by SitePoint.com
Using a menu to launch DevTools wastes valuable seconds! Try one of these options instead:
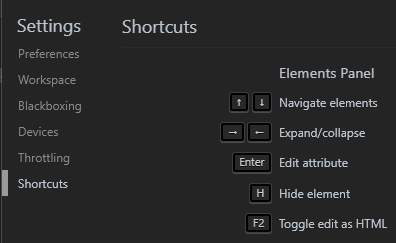
F12ctrl + shift + icmd + option + jChrome provides useful keyboard shortcut assistance. From DevTools, press F1 or select Settings from the three-dot menu at the top-right. Then choose Shortcutsfrom the menu:
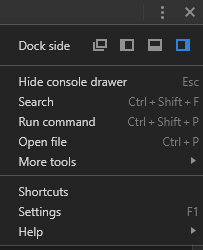
The DevTools pane can be docked to the left, right or bottom of the browser window. If you require more room, undock it to a separate window. Docking options are found in the main three-dot menu in Chrome:
and Firefox:
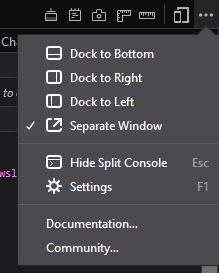
DevTool settings can be accessed from the same menu or by pressing F1. This allows you to set options such as the tools shown, theme, tab sizes, color units and more.
When working on a web application, it may be practical to create a dedicated desktop shortcut to launch your browser, open the URL and launch DevTools in a single step. For Chrome, create a desktop icon with the following Chrome command-line options:
chrome --auto-open-devtools-for-tabs http://localhost:8000/
where http://localhost:8000/ is your development URL.
Similarly for Firefox:
firefox -devtools -url http://localhost:8000/
(The executable name may differ across systems.)
Incognito/private mode does not retain data such as cookies and localStorage after the browser is closed. The mode is ideal for testing Progressive Web Apps (PWAs) and log-in systems.
You can start browsers in incognito mode manually or by adding --incognito to Chrome or -private to Firefox’s command line.
Chrome DevTools offers an editor-like command palette. Press ctrl + shift + p:
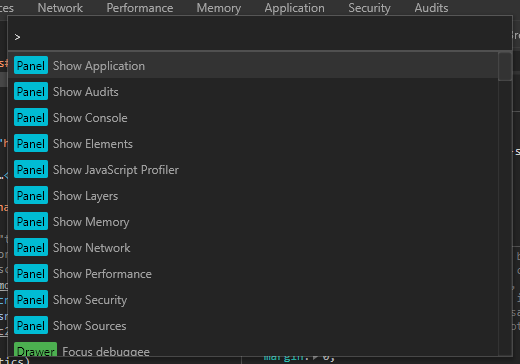
It provides quick access to most functions and source files (hit backspace to remove the >).
The console is useful regardless of which DevTool panel you’re using. Hit Esc to show and hide a console window in the bottom pane.
Most browsers show a color picker when you click any CSS color property. Chrome also shows the colors used in the page at the bottom of the panel:
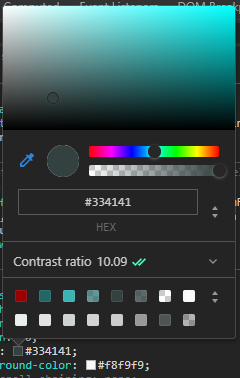
The panel can be clicked to show further colors.
The color picker also shows the contrast ratio which indicates the visual difference between the foreground text and background color. Click the ratio to view how this rates against AA and AAA accessibility standards which ensure text can be read by most people:
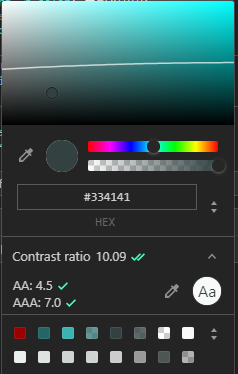
Any color below the line on the color swash will pass AA contrast recommendations.
From Chrome’s command palette (ctrl + shift + p), type ‘screenshot’ then choose an option to capture the current viewport, the whole page, or the currently-active element. The file will be saved to the download folder. (Chrome 74+ also permits area capture.)
Firefox provides the Take a screenshot system which is available from most menus. In addition, you can right-click any element in the DOM view and select Screenshot Node.
Chrome’s new Coverage panel allows you to quickly locate unused code. Select Coverage from the DevTools More tools sub-menu then hit the record button and browse around your application. Then click any file to open its source:
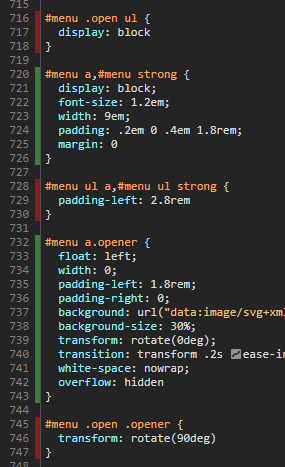
Unused code is highlighted in red in the line number gutter.
Note that Chrome does not appear to remember used/unused code when you navigate to a new page, but I expect this will be provided in a future release.
Check Disable cache in the Network panel to load all files from the network. This provides a better assessment of first-time page loads.
Similarly, there’s little point testing your system a 1gbps connection when most users access over 3G. The Network panel provides an Online drop-down in Chrome and a Throttling drop-down in Firefox which allows you to emulate specific network speeds.
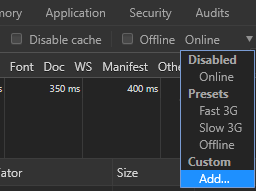
Chrome also provides a facility to add your own throttling profiles.
By default, the Network panel shows a table of requests and responses in download order. However, any table heading can be clicked to re-order by name, status, type, size, response time, etc.
To discover any incomplete or unresponsive HTTP requests, access the Networkpanel and enter is:running in the Filter box.
From the Network panel, enter larger-than:S in the Filter box, where S is a size in bytes (1000000), kilobytes (1000k), or megabytes (1M). Responses greater than the chosen size are shown.
To find responses which are smaller, use -larger-than:S.
From the Network panel, enter -domain:*.yourdomain in the Filter box, where yourdomain is your primary URL, e.g. news.teqnation.com. The remaining responses show third-party requests to CDNs, trackers, social media buttons, etc. The number of requests and payload sizes is shown in the status bar below the table.
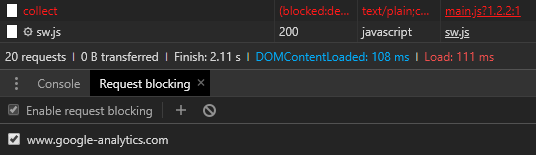
It is possible to block trackers, analytics, social media widgets, or any other requests during testing.
Right-click any HTTP request in Chrome’s Network panel and choose Block request URL to block that URL or Block request domain to block any request to that domain. The Request blocking panel will open where you can add or remove further URLs or domains:
Ajax XMLHttpRequest operations can be examined by right-clicking their entry on the Network table, then selecting a copy option such as cURL, fetch, or PowerShell. This creates a command with identical headers, user agent, cookies, and referrers which can be pasted into an editor or terminal.
Chrome allows any file to be saved to your system so the browser will fetch it from the device rather than the network. This could permit offline development if, for example, you wanted to load or edit assets normally accessed from a CDN.
Open the Overrides panel within Sources, click + Select folder for overrides, and select an appropriate folder.
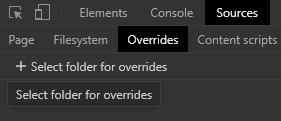
Now right-click any resource in the Network panel and select Save for overrides. Any subsequent page reload will access the file from your local system rather than the web. The saved file can also be modified.
The Application panel in Chrome and the Storage panel in Firefox allow you to examine, modify and delete values held in cookies, cache storage, localStorage, sessionStorage, IndexedDB, and Web SQL (where supported).
Chrome’s Clear storage panel can also wipe all values for a domain which can be useful when developing a Progressive Web App.
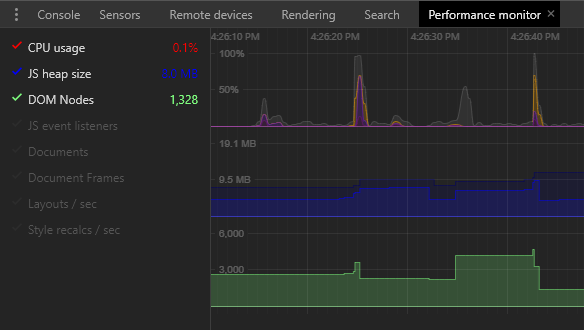
Chrome’s new Performance monitor can be accessed from the DevTools More toolsmenu and provides analysis of CPU usage, JavaScript heap size, DOM nodes, event listeners, style recalculations and more. Unlike the primary Performance panel, the charts are updated in real time – there is no need to record a profile first.
Chrome’s Audits panel was originally designed to assess Progressive Web App functionality but the tool has evolved into a general purpose tool to analyse performance, accessibility, best practices, and SEO in both mobile and desktop view.
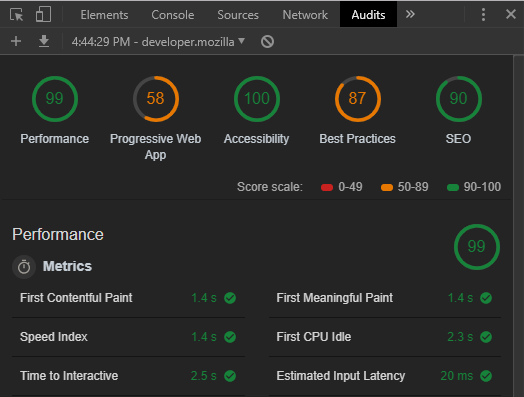
It won’t catch every problem and you may disagree with some points, but it’s a useful way to make a quick assessment of potential issues.[/vc_column_text][/vc_column][/vc_row]